NVDA Elliott Wave technical analysis [Video]
NVDA Elliott Wave Analysis Trading Lounge Daily Chart,
NVIDIA Corp., (NVDA) Daily Chart,
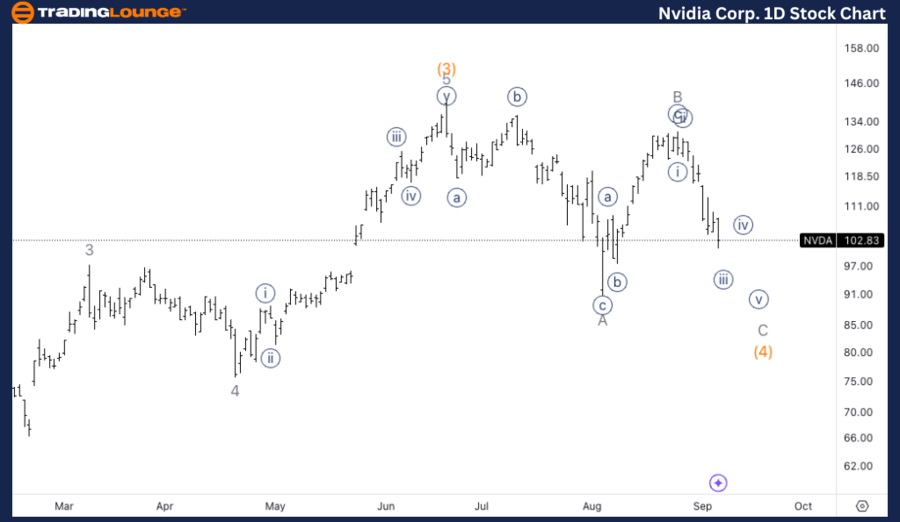
Function: Counter trend.
Mode: Corrective.
Structure: Flat.
Position: Intermediate wave (4).
Direction: Downside in wave (4).
Details: At this point we are looking for a three wave move in wave (4), with equality of C vs. A as target at 84$.
NVDA Elliott Wave Analysis Trading Lounge 1H Chart,
NVIDIA Corp., (NVDA) 1H Chart.
NVDA Elliott Wave technical analysisFunction: Countertrend.
Mode: Corrective.
Structure: Flat.
Position: Minor wave C.
Direction: Downside within wave C.
Details: Looking for further downside within wave C as we seem to be unfolding lower. We could expect a bounce in wave {iv} as we hit TL1 at 100$.
This analysis provides an Elliott Wave interpretation for NVIDIA Corp. (NVDA) based on both the daily and 1-hour charts. It outlines the current corrective trend and the key levels to watch as the stock navigates through a significant wave (4) correction.
NVDA Elliott Wave technical analysis – Daily chartNVIDIA is in a corrective structure, likely a flat correction, unfolding as a three-wave move. Currently, the stock is moving lower within wave C, and the next target for wave (4) is set at 84$, where equality between wave C and wave A is expected. This suggests a deeper correction before the resumption of the long-term trend.
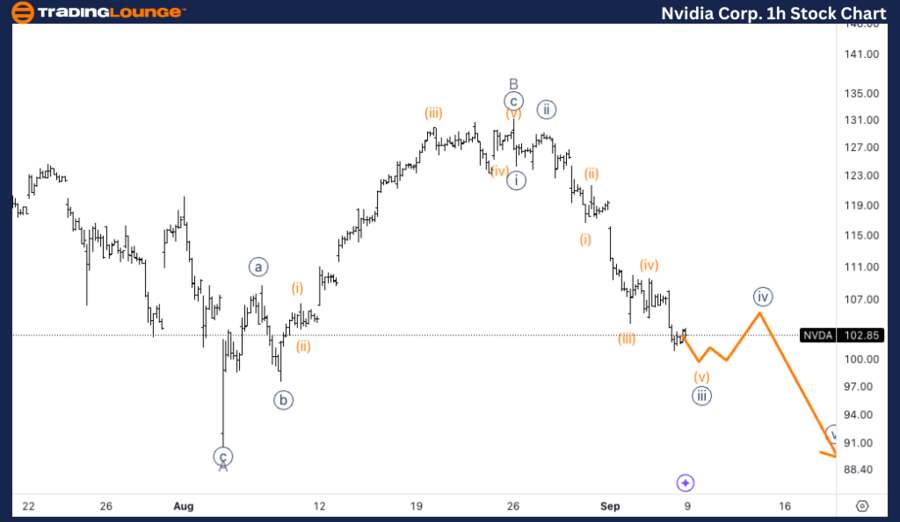
NVIDIA is currently progressing lower in wave C, and the next key support level is expected around 100$, near Trading Level1 (TL1). A bounce in wave {iv} of C could occur around this level before the final push lower to complete the correction. This would align with the structure's flat pattern, where wave C typically unfolds as a five-wave move.
Technical analyst: Alessio Barretta.
NVDA Elliott Wave technical analysis [Video]As with any investment opportunity there is a risk of making losses on investments that Trading Lounge expresses opinions on.
Historical results are no guarantee of future returns. Some investments are inherently riskier than others. At worst, you could lose your entire investment. TradingLounge™ uses a range of technical analysis tools, software and basic fundamental analysis as well as economic forecasts aimed at minimizing the potential for loss.
The advice we provide through our TradingLounge™ websites and our TradingLounge™ Membership has been prepared without considering your objectives, financial situation or needs. Reliance on such advice, information or data is at your own risk. The decision to trade and the method of trading is for you alone to decide. This information is of a general nature only, so you should, before acting upon any of the information or advice provided by us, consider the appropriateness of the advice considering your own objectives, financial situation or needs. Therefore, you should consult your financial advisor or accountant to determine whether trading in securities and derivatives products is appropriate for you considering your financial circumstances.


![NVDA Elliott Wave technical analysis [Video]](/_largethumb/uploads/news/112/11279/6/11279601-nvda-elliott-wave-technical-analysis-video.jpg.webp)
![NVDA Elliott Wave technical analysis [Video]](/_newsthumb/uploads/news/112/11279/6/11279601-nvda-elliott-wave-technical-analysis-video.jpg.webp)


